
Management dashboard
Bring sales, service and operational KPIs into one understandable view.
Turn disconnected spreadsheets, databases and reports into clear KPIs, executive dashboards and more reliable operational decisions.
A thoughtful approach to technology choices, implementation and long-term usability.
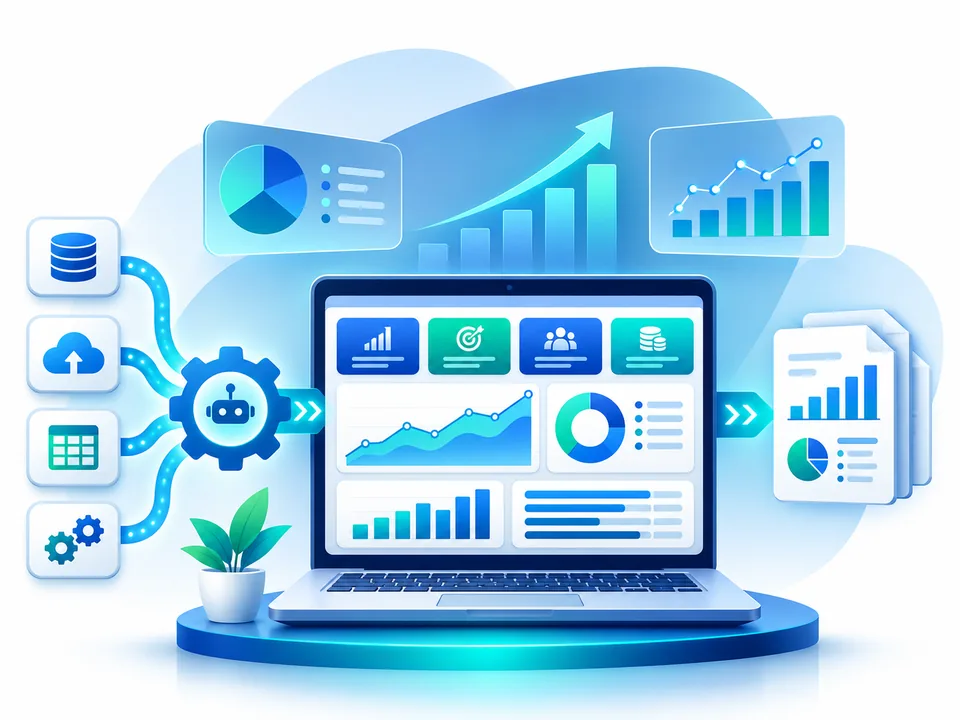
Business dashboards, reporting models and decision-support insights from the data your organization already uses.
These examples describe possible applications, not completed projects or promised results.
Bring sales, service and operational KPIs into one understandable view.
Reduce manual spreadsheet preparation and make source assumptions explicit.
Compare campaign channels, conversion signals and reporting quality.
Explore AI project solutions ↗
Understand objectives, systems, workflows, constraints and risks.
Define a realistic roadmap, priorities and success criteria.
Build, configure, integrate and validate the selected approach.
Review performance and support practical improvements.
Projects may use Power BI, Excel, SQL, Power Query, Tableau or Python depending on data sources and requirements.
Often yes, subject to permissions, source quality and integration capabilities.
Scheduled refresh is possible in supported systems, with licensing and infrastructure requirements assessed beforehand.
Streamline repetitive tasks, approvals, notifications and data handoffs across connected business tools.
Explore service ↗Search visibility, performance marketing and analytics-led campaigns built around relevant business outcomes.
Explore service ↗Thoughtful Android, iOS and cross-platform app planning and development for customer or internal experiences.
Explore service ↗Discuss your objectives across AI, analytics, automation, development and digital growth. We'll start by understanding the challenge.